The Role of Mapping in The Produce Industry’s Transition to Digital Business Solutions: Part 1 – Field Operations
By Claire Zoellner
PhD Food Safety Scientist
July 17, 2020
Mapping has been an under-utilized element in a food safety plan and can be especially critical for decision-making in uncertainty and for communication across various levels of an organization. Specific intelligence gained from live updates on key spatial information and data can mitigate business risks. The breadth of mapping utility in the produce industry can be likened to society’s increasing dependence on a global position system (GPS) and live road maps to find optimal routes based on specific criteria, to automate rerouting when we’re off course or if there are unexpected obstacles along the way, and to calculate fuel efficiency. Detailed mapping can serve multiple purposes from food safety and quality to sustainability and marketing, and may lay the groundwork for deployment of other technology, thus facilitating the transition to digital business and food safety solutions. Part 1 of this blog highlights use cases in field operations, while Part 2 will expand the scope of processing facilities and supply chains.
The quality of a ranch or field map will contribute to its utility for business intelligence. A map is simply a diagrammatic representation of an area showing physical features and/or landmarks. At a minimum, it should be precise and up to date, including dimensions, scales, and a reference point. Numerical dimensions or coordinates, grid lines, and scales improve representation of reality and depict the relationships between objects within a certain area, although choosing an appropriate scale is a balance between including sufficient information and making the map readable. Typically, static or permanent data – such as acreage, lot numbers, buffer zones, water sources, pest traps and/or fences, and restrooms and break areas – are illustrated on a ranch map for use in traceability and risk assessment exercises as part of developing a farm food safety plan. Photos, and drawings or diagrams can be used to communicate this permanent ranch information.
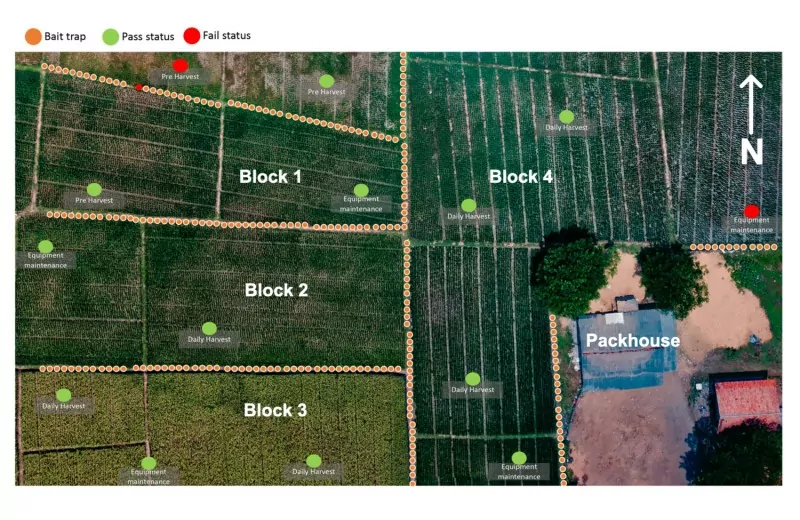
Beyond documentation of this permanent data, with a high-quality map like a satellite image with GPS coordinates, there is potential to use maps to track live and dynamic data in space and time. Real-time analytics platforms can streamline the maintenance, collection, and visualization of spatial or mapped data at the ranch-level or for entire fields and regions. Layers of spatial information are added to a map by pulling various data streams based on location coordinates. In the example here, ranch-specific assessments for daily harvest, equipment sanitation and pest bait stations are pinned onto the ranch map at the location of the observations. This information is archived over time to visualize season- or time-related trends in areas of increased risks; trends that may impact root cause analysis and decisions around where to plant, how to minimize risks, or when to harvest.
Laying out key data streams and tasks to field locations provides context to performance metrics and failures. Coupled with actionable information and real-time alerts, mapping aids in identification of potential problems before consequences arise. In the data-driven age of food production, ranch and field maps will have increasing utility for optimization of practices. Future data sources may eventually include land use, soil properties, elevation and slope, and weather data from existing or proposed national databases.


